Exploring Visual Information Flows in Infographics
Association for Computing Machinery: Proceedings of the 2020 CHI Conference on Human Factors in Computing Systems, 2020.
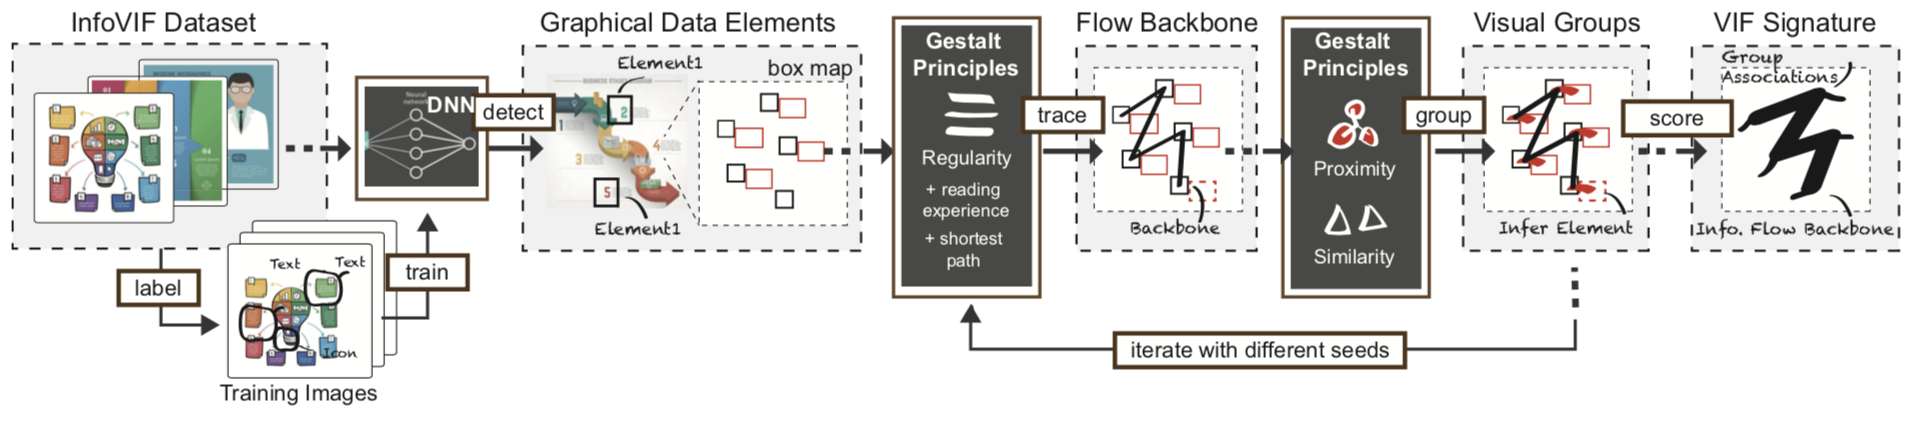
Infographics are engaging visual representations that tell an informative story using a fusion of data and graphical elements. The large variety of infographic design poses a challenge for their high-level analysis. We use the concept of Visual Information Flow (VIF), which is the underlying semantic structure that links graphical elements to convey the information and story to the user. To explore VIF, we collected a repository of over 13K infographics. We use a deep neural network to identify visual elements related to information, agnostic to their various artistic appearances. We construct the VIF by automatically chaining these visual elements together based on Gestalt principles. Using this analysis, we characterize the VIF design space by a taxonomy of 12 different design patterns. Exploring in a real-world infographic dataset, we discuss the design space and potentials of VIF in light of this taxonomy.