MulteeSum: A Tool for Comparative Spatial and Temporal Gene Expression Data
IEEE Transactions on Visualization and Computer Graphics, 2010.
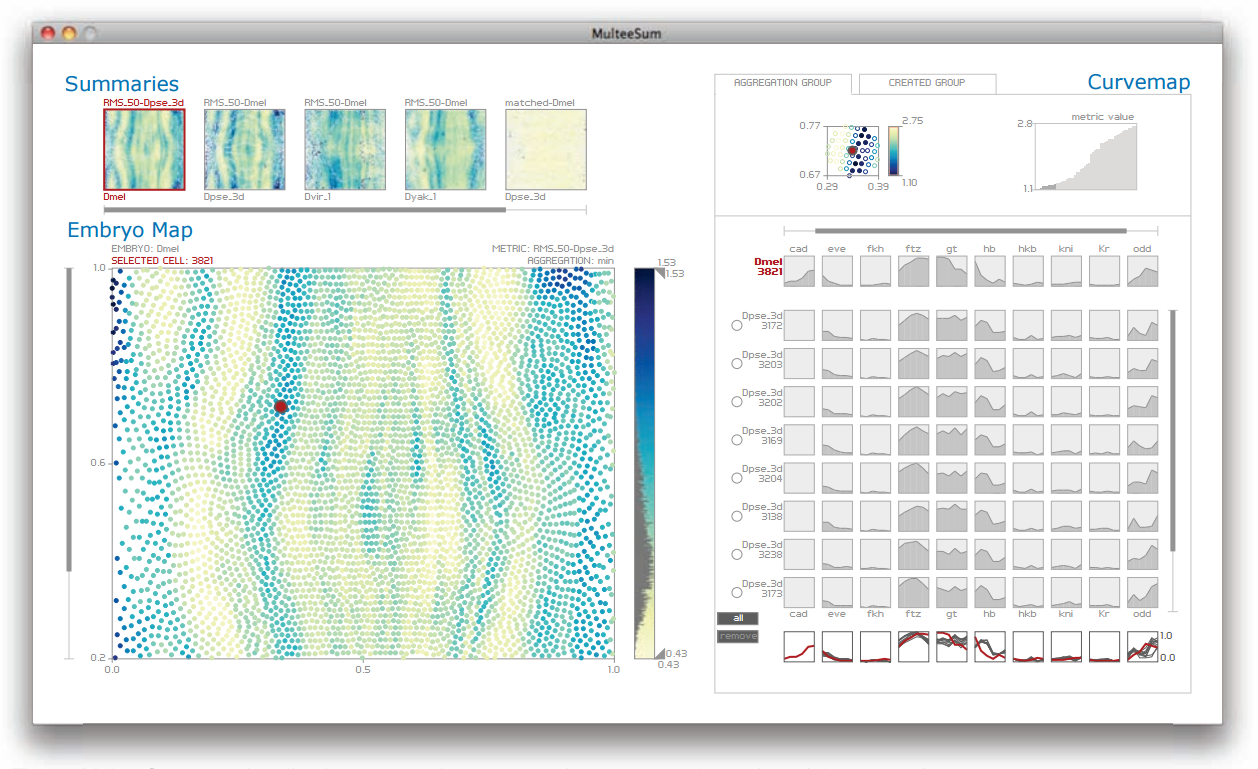
Cells in an organism share the same genetic information in their DNA, but have very different forms and behavior because of the selective expression of subsets of their genes. The widely used approach of measuring gene expression over time from a tissue sample using techniques such as microarrays or sequencing do not provide information about the spatial position within the tissue where these genes are expressed. In contrast, we are working with biologists who use techniques that measure gene expression in every individual cell of entire fruitfly embryos over an hour of their development, and do so for multiple closely-related subspecies of Drosophila. These scientists are faced with the challenge of integrating temporal gene expression data with the spatial location of cells and, moreover, comparing this data across multiple related species. We have worked with these biologists over the past two years to develop MulteeSum, a visualization system that supports inspection and curation of data sets showing gene expression over time, in conjunction with the spatial location of the cells where the genes are expressed textemdash it is the first tool to support comparisons across multiple such data sets. MulteeSum is part of a general and flexible framework we developed with our collaborators that is built around multiple summaries for each cell, allowing the biologists to explore the results of computations that mix spatial information, gene expression measurements over time, and data from multiple related species or organisms. We justify our design decisions based on specific descriptions of the analysis needs of our collaborators, and provide anecdotal evidence of the efficacy of MulteeSum through a series of case studies.