Pathline: A Tool for Comparative Functional Genomics
Computer Graphics Forum (Proc. of EuroVis), 2010.
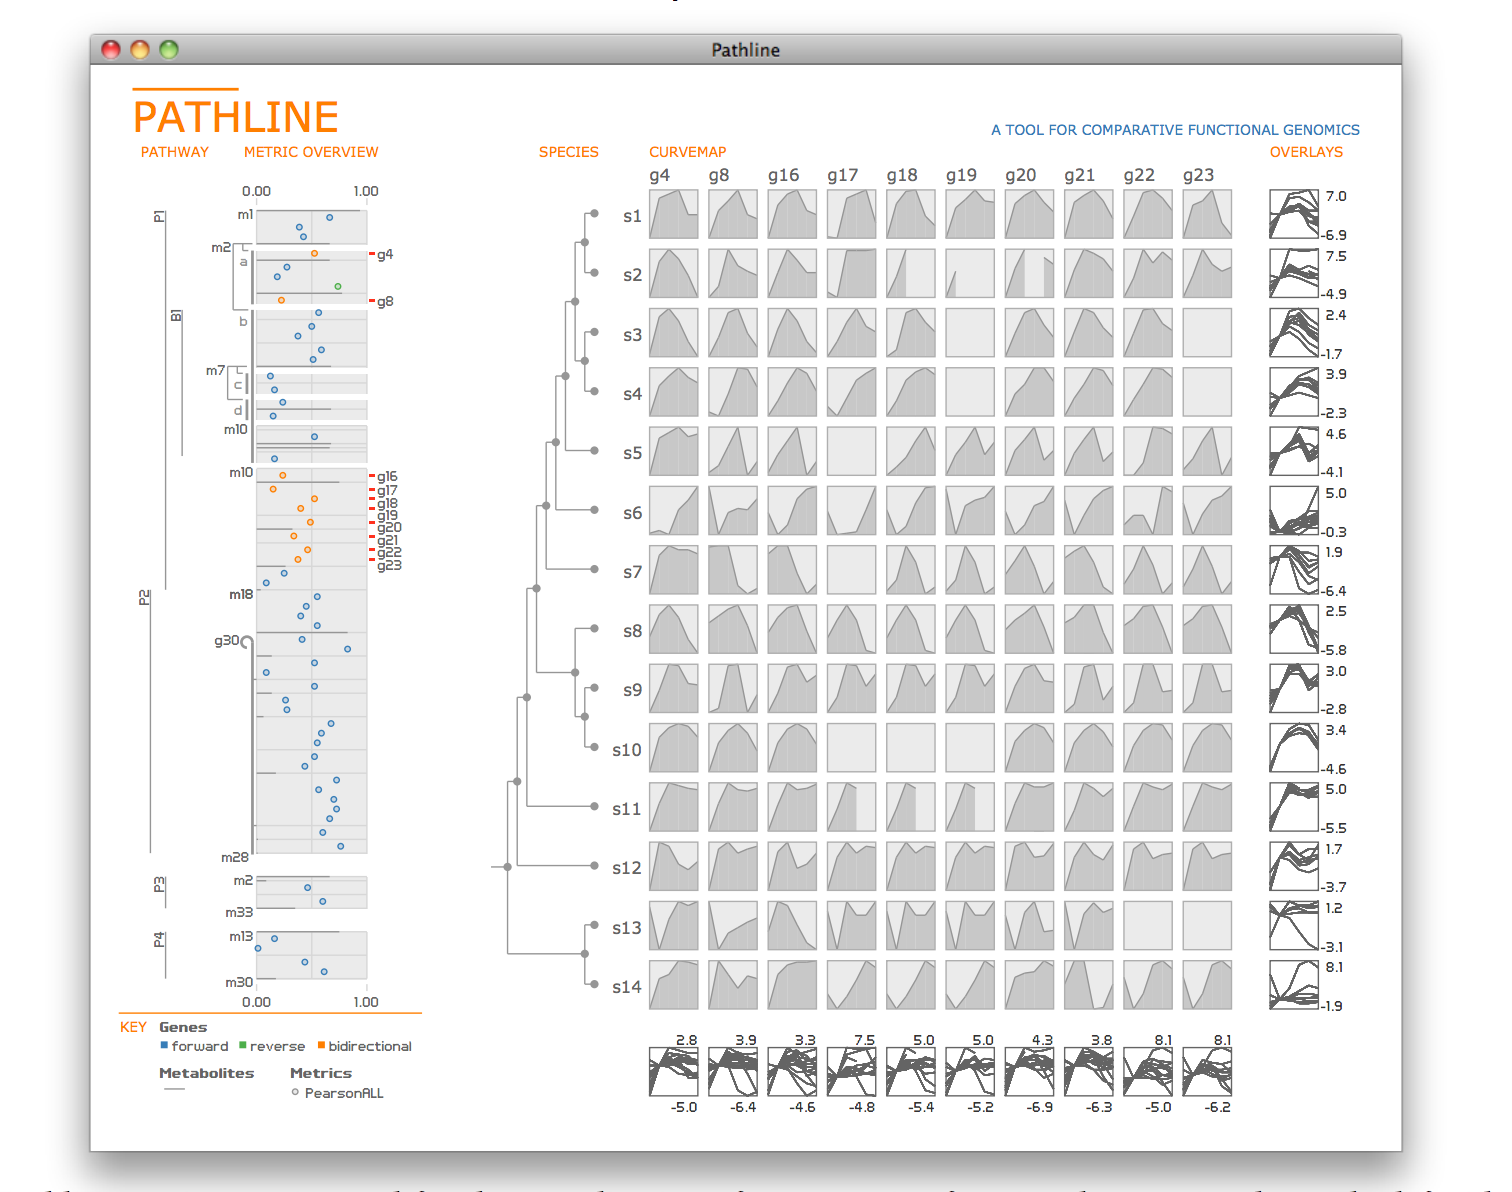
Biologists pioneering the new field of comparative functional genomics attempt to infer the mechanisms of gene regulation by looking for similarities and differences of gene activity over time across multiple species. They use three kinds of data: functional data such as gene activity measurements, pathway data that represent a series of reactions within a cellular process, and phylogenetic relationship data that describe the relatedness of species. No existing visualization tool can visually encode the biologically interesting relationships between multiple path- ways, multiple genes, and multiple species. We tackle the challenge of visualizing all aspects of this comparative functional genomics dataset with a new interactive tool called Pathline. In addition to the overall characterization of the problem and design of Pathline, our contributions include two new visual encoding techniques. One is a new method for linearizing metabolic pathways that provides appropriate topological information and supports the comparison of quantitative data along the pathway. The second is the curvemap view, a depiction of time series data for comparison of gene activity and metabolite levels across multiple species. Pathline was developed in close collaboration with a team of genomic scientists. We validate our approach with case studies of the biologists use of Pathline and report on how they use the tool to confirm existing findings and to discover new scientific insights.