ProteomeVis: a web app for exploration of protein properties from structure to sequence evolution across organisms' proteomes
Bioinformatics, 2018.
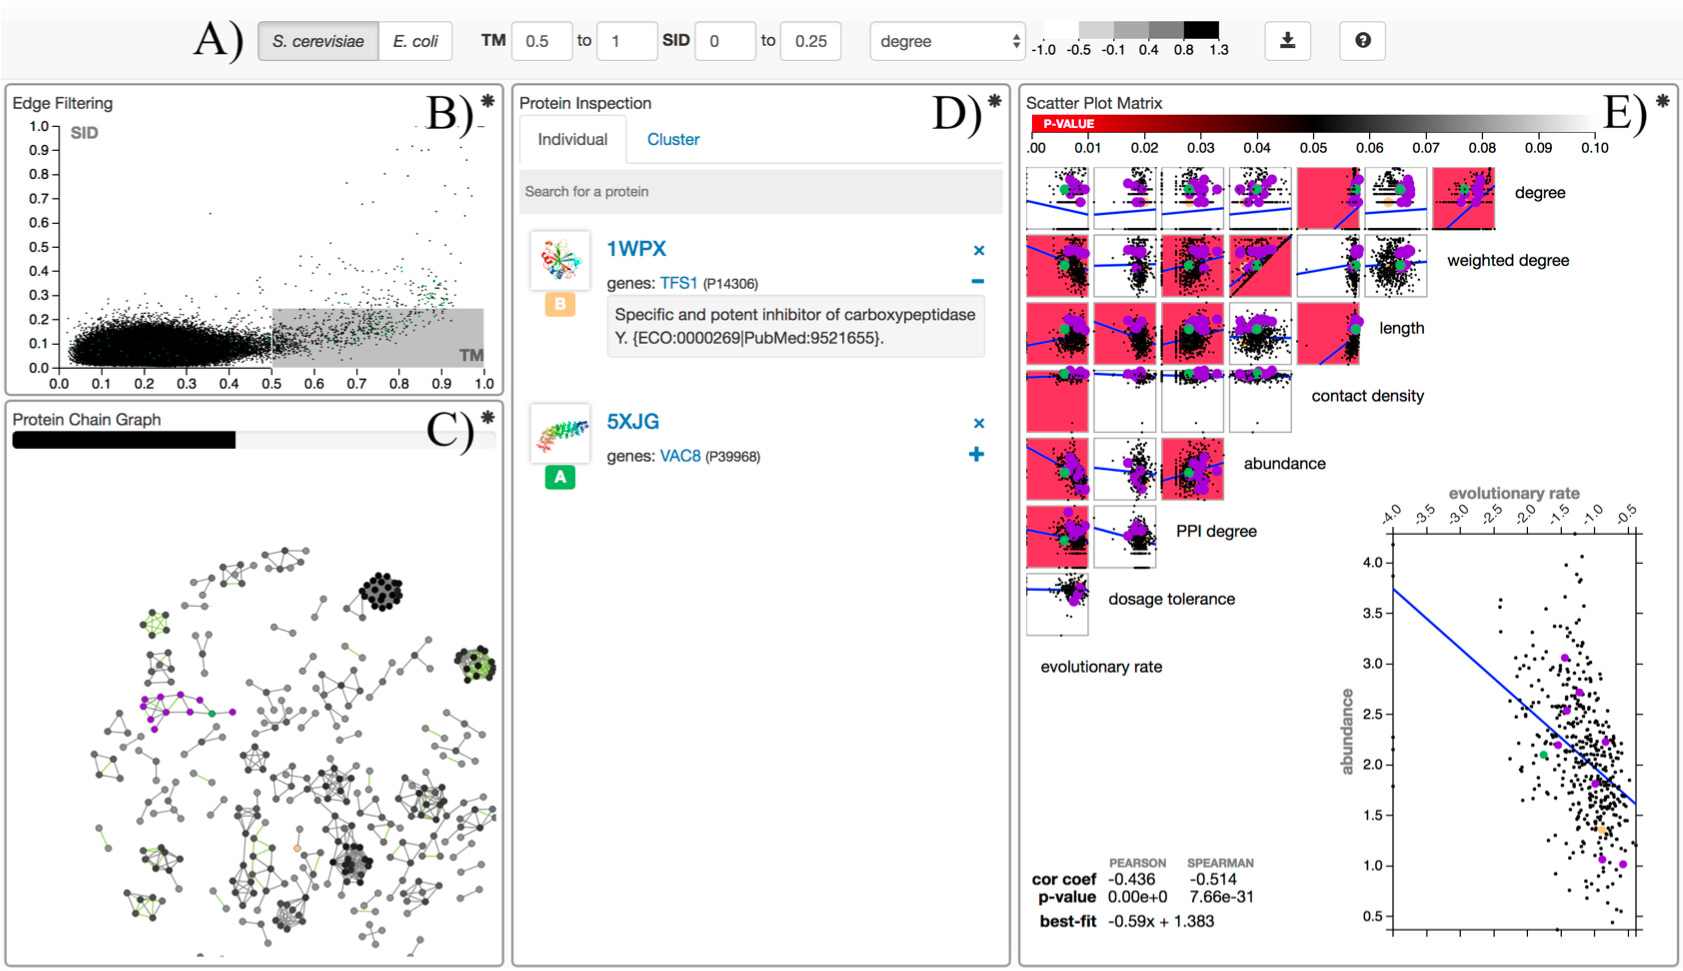
Motivation: Protein evolution spans time scales and its effects span the length of an organism. A web app named ProteomeVis is developed to provide a comprehensive view of protein evolution in the S. cerevisiae and E. coli proteomes. ProteomeVis interactively creates protein chain graphs, where edges between nodes represent structure and sequence similarities within user-defined ranges, to study the long time scale effects of protein structure evolution. The short time scale effects of protein sequence evolution is studied by sequence evolutionary rate (ER) correlation analyses with protein properties that span from the molecular to the organismal level. Results: We demonstrate the utility and versatility of ProteomeVis by investigating the distribution of edges per node in organismal protein chain universe graphs (oPCUGs) and putative ER determinants. S. cerevisiae and E. coli oPCUGs are scale-free with scaling constants of 1.78 and 1.50, respectively. Both scaling constants can be explained by a previously reported theoretical model describing protein structure evolution (Dokholyan et al., 2002). Protein abundance most strongly correlates with ER among properties in ProteomeVis, with Spearman correlations of -0.51 (p-value<10E-10) and -0.46 (p-value<10E-10) for S. cerevisiae and E. coli, respectively. This result is consistent with previous reports that found protein expression to be the most important ER determinant (Zhang and Yang, 2015). Availability: ProteomeVis is freely accessible at http://proteomevis.chem.harvard.edu/proteomevis/.