Scalable Interactive Visualization for Connectomics
Informatics, 2017.
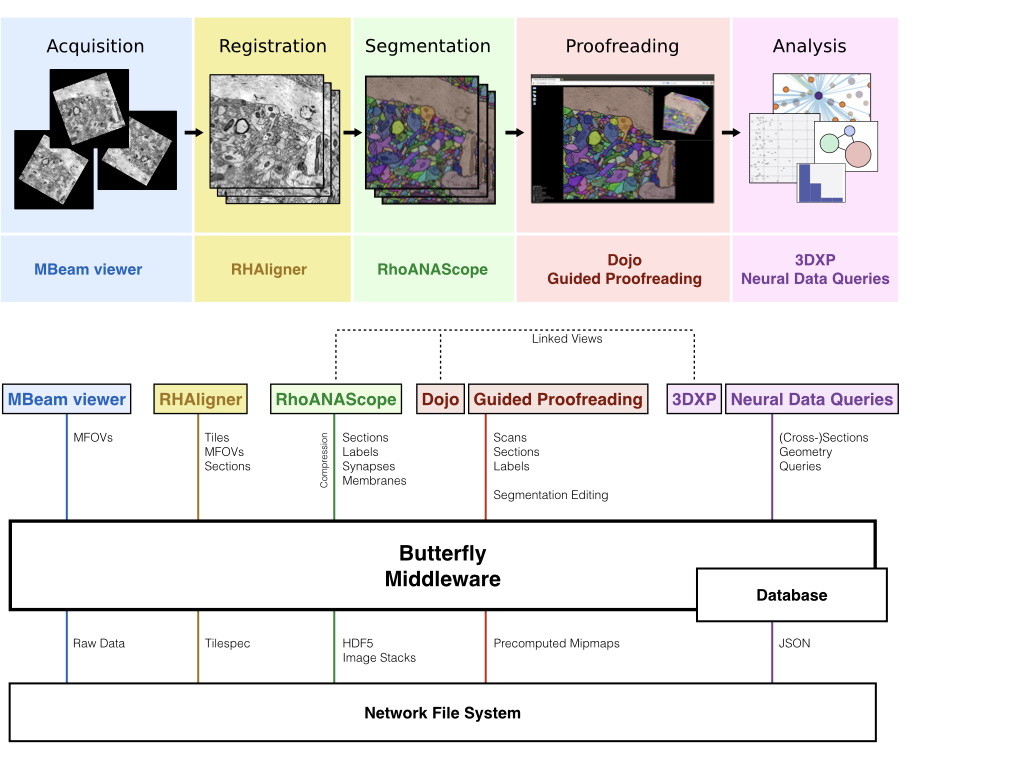
Connectomics has recently begun to image brain tissue at nanometer resolution, which produces petabytes of data. This data must be aligned, labeled, proofread, and formed into graphs, and each step of this process requires visualization for human verification. As such, we present the BUTTERFLY middleware, a scalable platform that can handle massive data for interactive visualization in connectomics. Our platform outputs image and geometry data suitable for hardware-accelerated rendering, and abstracts low-level data wrangling to enable faster development of new visualizations. We demonstrate scalability and extendability with a series of open source Web-based applications for every step of the typical connectomics workflow: data management and storage, informative queries, 2D and 3D visualizations, interactive editing, and graph-based analysis. We report design choices for all developed applications and describe typical scenarios of isolated and combined use in everyday connectomics research. In addition, we measure and optimize rendering throughput—from storage to display—in quantitative experiments. Finally, we share insights, experiences, and recommendations for creating an open source data management and interactive visualization platform for connectomics.