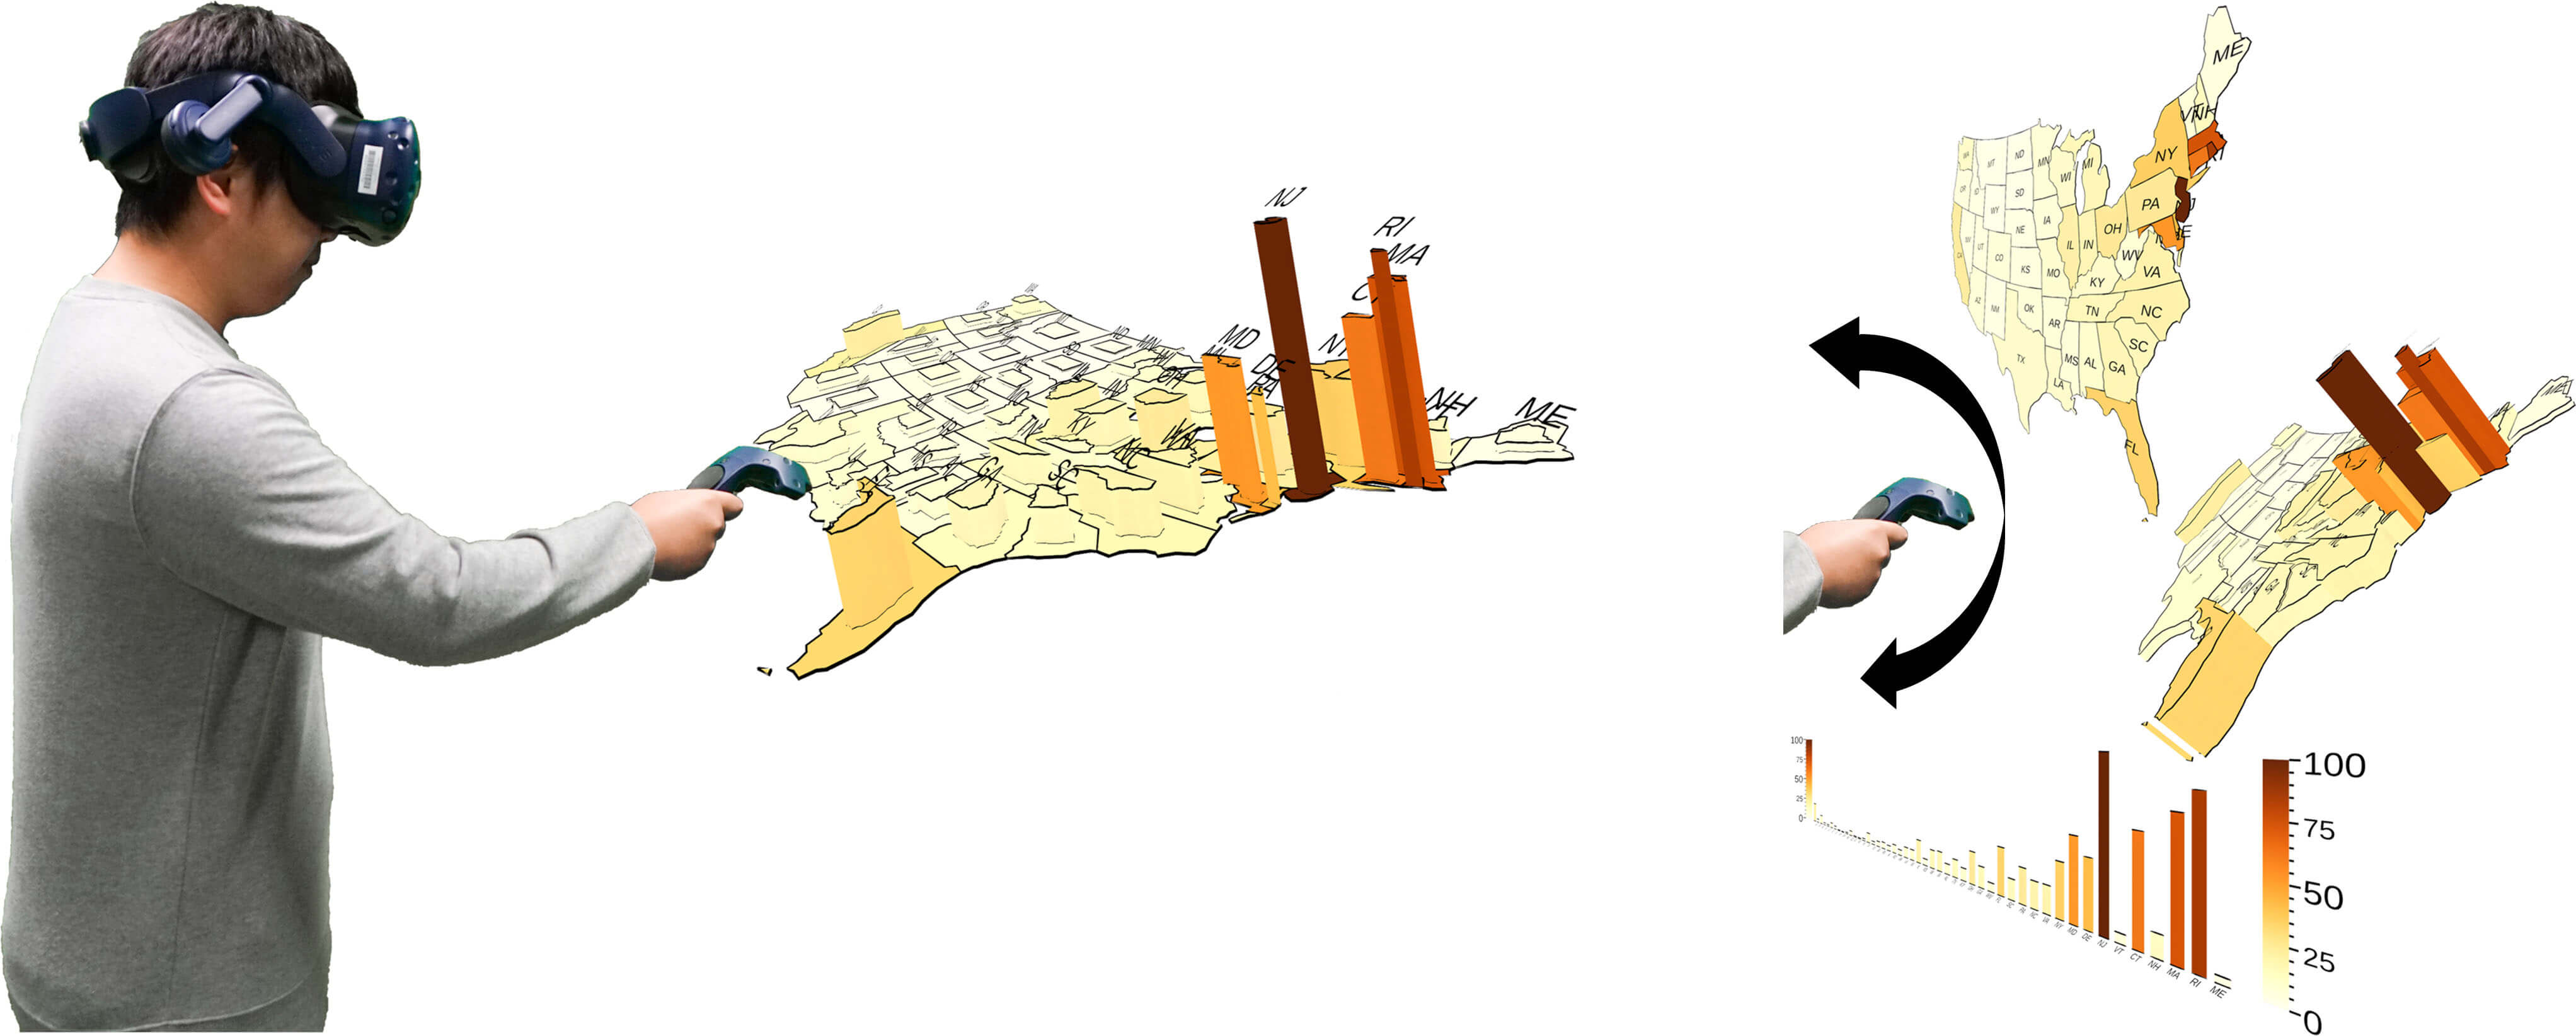
Tilt Map: Interactive Transitions Between Choropleth Map, Prism Map and Bar Chart in Immersive Environments
IEEE Transactions on Visualization and Computer Graphics, 2020.
We introduce Tilt Map, a novel interaction technique for intuitively transitioning between 2D and 3D map visualisations in immersive environments. Our focus is visualising data associated with areal features on maps, for example, population density by state. Tilt Map transitions from 2D choropleth maps to 3D prism maps to 2D bar charts to overcome the limitations of each. Our article includes two user studies. The first study compares subjects’ task performance interpreting population density data using 2D choropleth maps and 3D prism maps in virtual reality (VR). We observed greater task accuracy with prism maps, but faster response times with choropleth maps. The complementarity of these views inspired our hybrid Tilt Map design. Our second study compares Tilt Map to: a side-by-side arrangement of the various views; and interactive toggling between views. The results indicate benefits for Tilt Map in user preference; and accuracy (versus side-by-side) and time (versus toggle).